


Weekly Hot Take - BRICS
3/07-7/07

Welcome everyone!
Hello everyone, and welcome to another weekly update on the precious metals market. We have been looking for an intermediate cycle to form over the last two newsletters, and it finally looks like we have a potential setup in place. It is important now that we hold onto the current structure before things turn too ugly. Last week, we talked about geopolitical problems, and this week, there is news out about the BRICS being backed by GOLD. All important pieces of the puzzle. It is, however, really important not to get our hopes up because of news events! We always focus on the charts, as charts don’t lie.
Let’s dive into the analysis of this week, which is FREE for everyone:
Precious Metals
XAUUSD
(Monthly)

The structure of higher highs and higher lows is still intact on the monthly view. For the current ICL, we broke the important $1923 signal, as that level had tons of stops. Important for our indicators is that we stayed above our monthly EMAs, which are showing us the trend on longer timeframes. To repeat again, we are BULLISH above the EMAs and BEARISH below. Timing-wise, we are perfectly in the timing band for an ICL.
(Weekly)
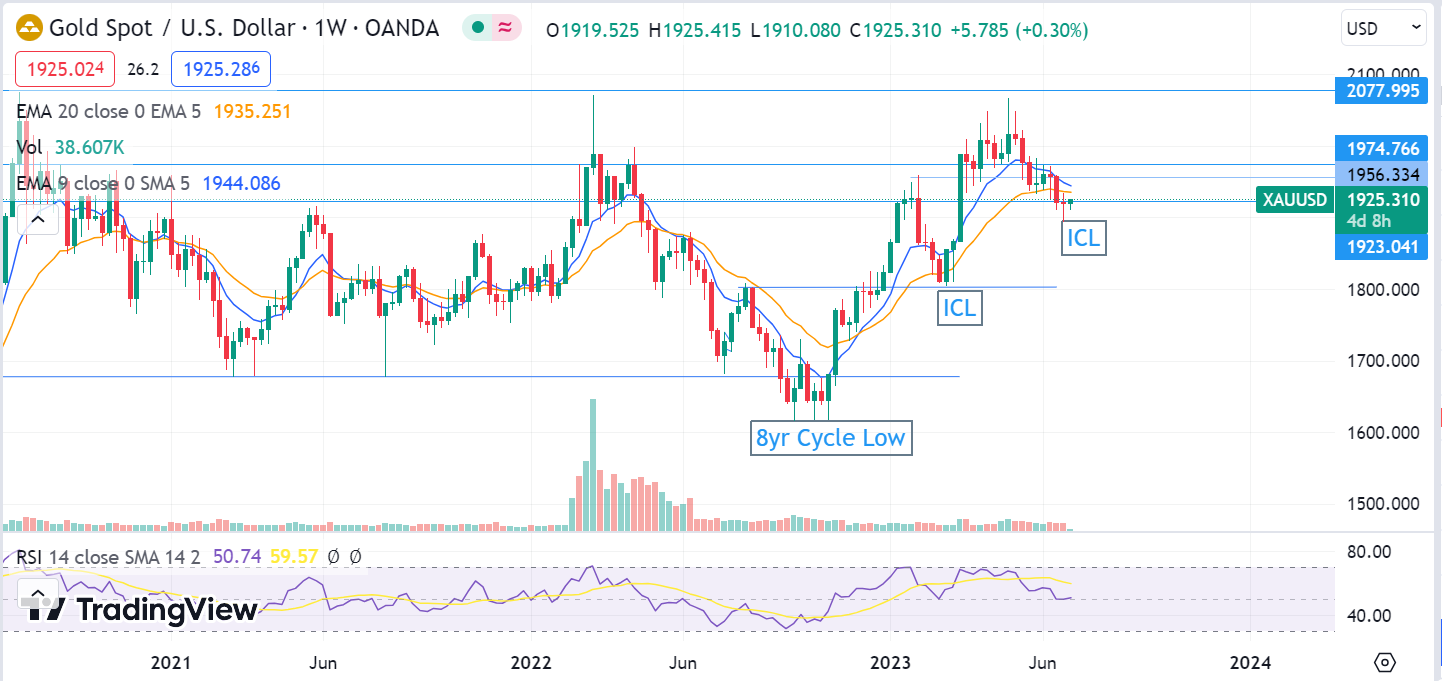
For the weekly candles, we can see that last time we were about 2 candles below the EMAs at the last weekly cycle low. That would imply that we want no more than 2 candles below the EMAs this time to remain bullish here on the weekly chart. Since both EMAs are also pinched, it should be now that we push back above both. I think it is a 100% must that we close this week above $1923. On the upside, I am looking at $1974 next up and then back to $2100. If we close this week below $1923, then I will start to reduce positions to preserve some cash in case of longer consolidations.
(Daily)

From a daily perspective, we are definitely going the right way as a DCL is being confirmed. We are now waiting for the weekly candles to push upwards and to close above the weekly EMAs, and then we can also conclude this low as the ICL. $1923 remains our important line in the sand.
XAGUSD
(Monthly)
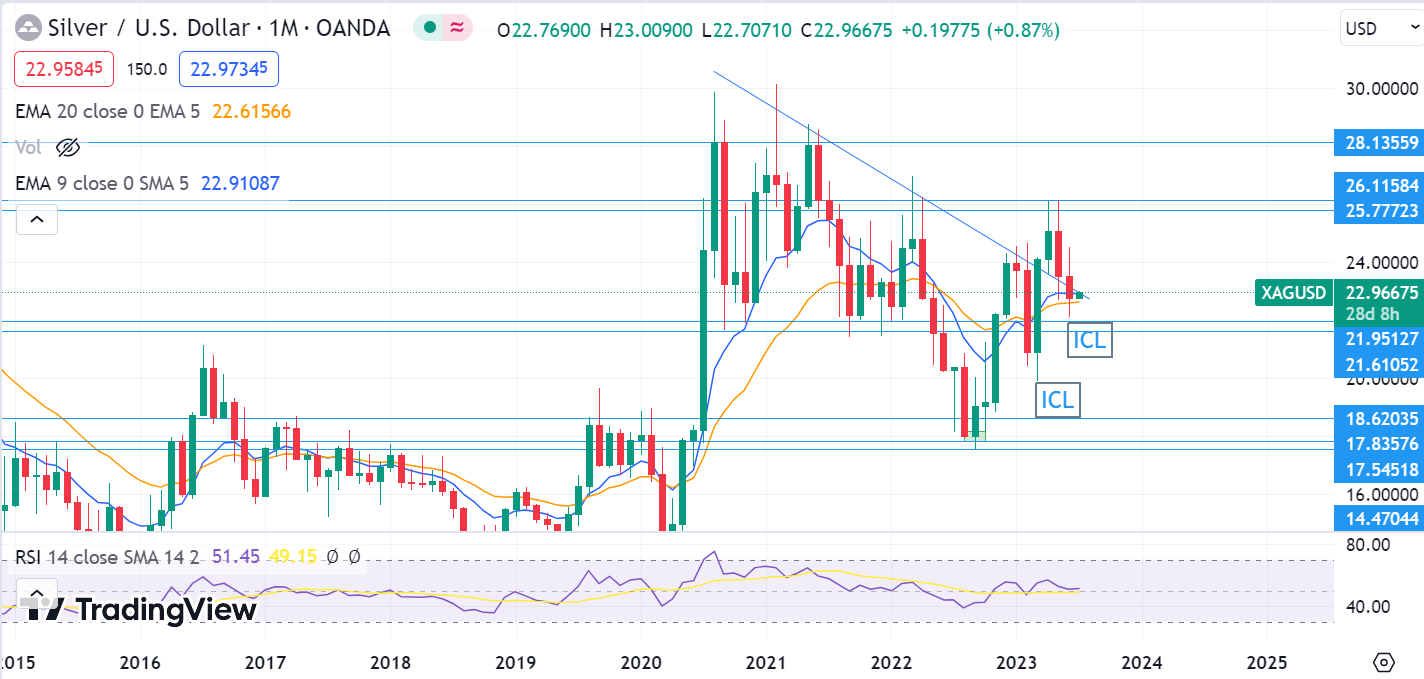
The monthly candles show us that we are being supported by the EMAs. Important is that we regain the downward-sloping trendline in the month of July and that we also regain $24 silver. If we get a monthly close below both EMAs, then we will take a bearish stance on silver.
(Weekly)

For the weekly candles, we are well below the EMAs, just as last ICL. Given our bullish bias on the longer-term view and on gold, I think silver will have a couple of monster weeks to the upside to get back above the weekly EMAs. If we don’t regain the EMAs within the next 2 weeks, then we will be bearish on the weekly view.

The daily chart shows a beautiful bottoming pattern as we are regaining the EMA 9 on a positive divergence. The setup is 100% there for the next leg to start up. That being said, it’s now or never. It’s up to silver here to follow the bullish structure in gold. When we regain $24, we can start looking again at the very important $25.77-$26.11 that we have been talking about in almost every newsletter.
SUMMARY
Silver has a beautiful bottoming pattern and is ready to regain both the EMAs and $24.
Gold weekly candles should regain $1923 and hold above it to keep the bullish structure intact.
Don’t be blinded by news events such as the BRICS and geopolitical issues. Charts don’t lie.
If we were to break the bottoming patterns, then I would send out immediate Twitter warnings through the private Twitter.
If you enjoyed the newsletter, don’t forget to like, share, and subscribe! Also, if you have any comments, feel free to comment below.