Welcome friends!
Hello everyone, and welcome to another weekly hot take! The past week, just as we were inching closer to the breakout level, we got a big smackdown. Does this imply that the move is over and that we can forget about our breakout? No.
Let me explain why we can still breakout and how this will look going forward.
Make sure to subscribe to the newsletter, as it is a very important one. Moreover, we are almost at the 1-year anniversary of our newsletter, so there are going to be very big benefits for all the subscribers.
Precious Metals
XAUUSD
(Monthly)
First of all, looking at historical data, this looks extremely similar fractal-wise. Same type of pattern. These days, we have interest rates to be lowered again, geopolitical issues, inflation, and much more as fundamentals for why gold will break out.
Second chart gives a good example of nasty shakeouts that happen during a big trending move in an attempt to shake out the weak longs. Imo my hard stop would be $1974, the rest is noise and chop. Let’s look at the real danger next:
(Weekly)
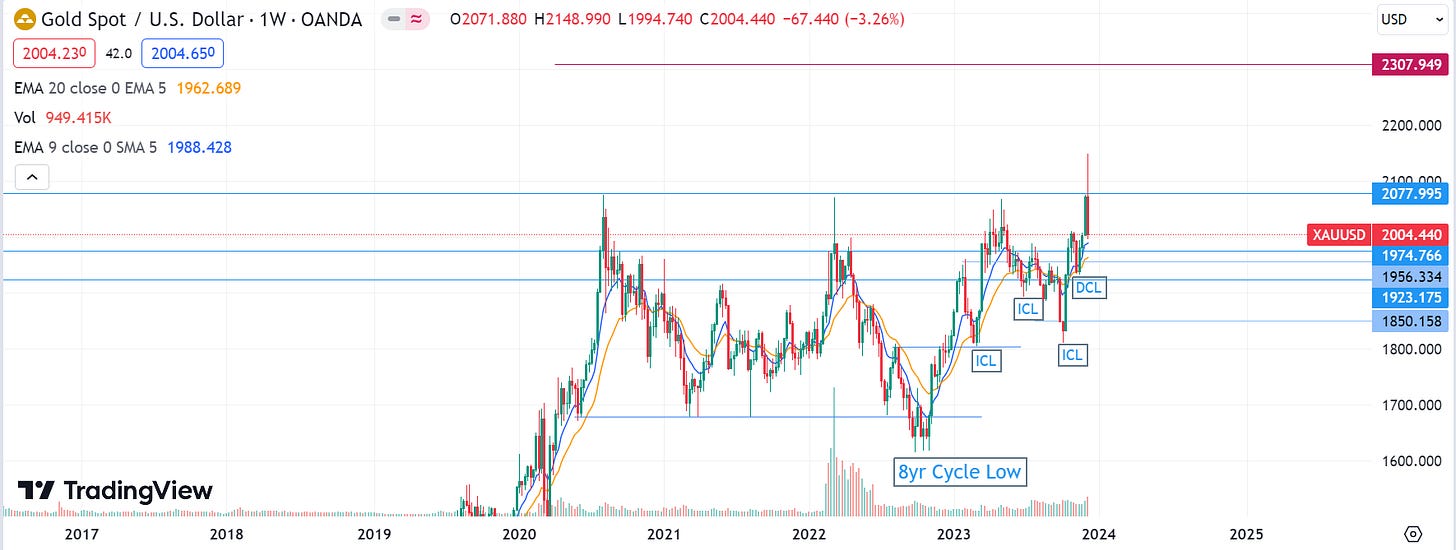
The weekly is still looking good, but we have to be aware of the potential danger that a candle like this brings. At the minimum, this shows us that the bears can still step in whenever they want. I’m not putting too much weight into it, as the spike happened overnight on extremely light volume, where someone probably tried to squeeze some shorts. For our system, the goal is that we stay above the weekly EMAs and that we strongly move towards $2077 again after some more stopruns early next week.
(Daily)
Cycle-wise, nothing is broken. Daily cycles are formed just below the daily EMAs before they are recovered again in the next daily cycle. I’m confident that we will recover the EMAs as soon as the stop runs towards $1974 are over. From EW behavior, we want a very aggressive uptrend to start right after the next DCL.
XAGUSD
(Monthly)
For the monthly candles in silver, I’m quite surprised that we got rejected so hard again. Given that we have had our resistance zone there tested so many times, it still seems rock solid. The amount of chop in silver has been ridiculous and unpredictable, I measure 13 MONTHLY CANDLES of up down between $22 and $25.77!
Let’s focus on gold, as that will guide us through this chop in silver.
(Weekly)
If we are looking for similarities here, I can only see July 2020, July 2021, and around March 2022, where we had these nasty rejections. All of those led to massive sell-offs. All I can say for silver at this point is that we need to clear $25.77 to get fully bullish. There is almost no guidance possible based on the silver charts. That’s why we’ll focus on gold for direction, and we assume that silver will follow when gold breaks the ATH.
General market
SPY
(Daily)
For now, the market seems to be making higher highs and higher lows. The danger here lies for me in the fact that I’ve seen a lot of insider selling, and I don’t see how this party continues in this macro-economic environment. I see a big risk of a major sell-off, even though the chart looks good. Maybe we get an overshoot next week before we do a nasty correction again, or if markets persist, then we will head towards $480 again. I do think that the major sell-off needs a black swan event. So as long as that doesn’t pop up, we are in the clear here. Don’t be mistaken; there are a lot of potential black swans lingering around, but none of them has materialized yet.
Summary
Gold chart for guidance; nothing is broken yet if we move up strongly after the next DCL and if we defend $1974.
Silver has too much noise and chop; the chart looks ugly. —> follows gold.
General markets are on an upward trend. But be careful for black swans that might come to fruition.


