


Weekly Hot Take - Holding the line
7/08-11/08

Welcome friends!
Hello everyone, and welcome to another weekly hot take! This week, we will discuss the progress the metals have made so far since the important inflection point and then lay out some probable scenarios that could unfold!
Last week, we mentioned that metals were making daily cycle lows and that there was tons of bearish pressure. Also in the summary, we mentioned that we have to be very alert for cycle failures here, which would indicate much more downside to come.
Let’s dive right into this week’s analysis!
Precious Metals
XAUUSD
(Monthly)
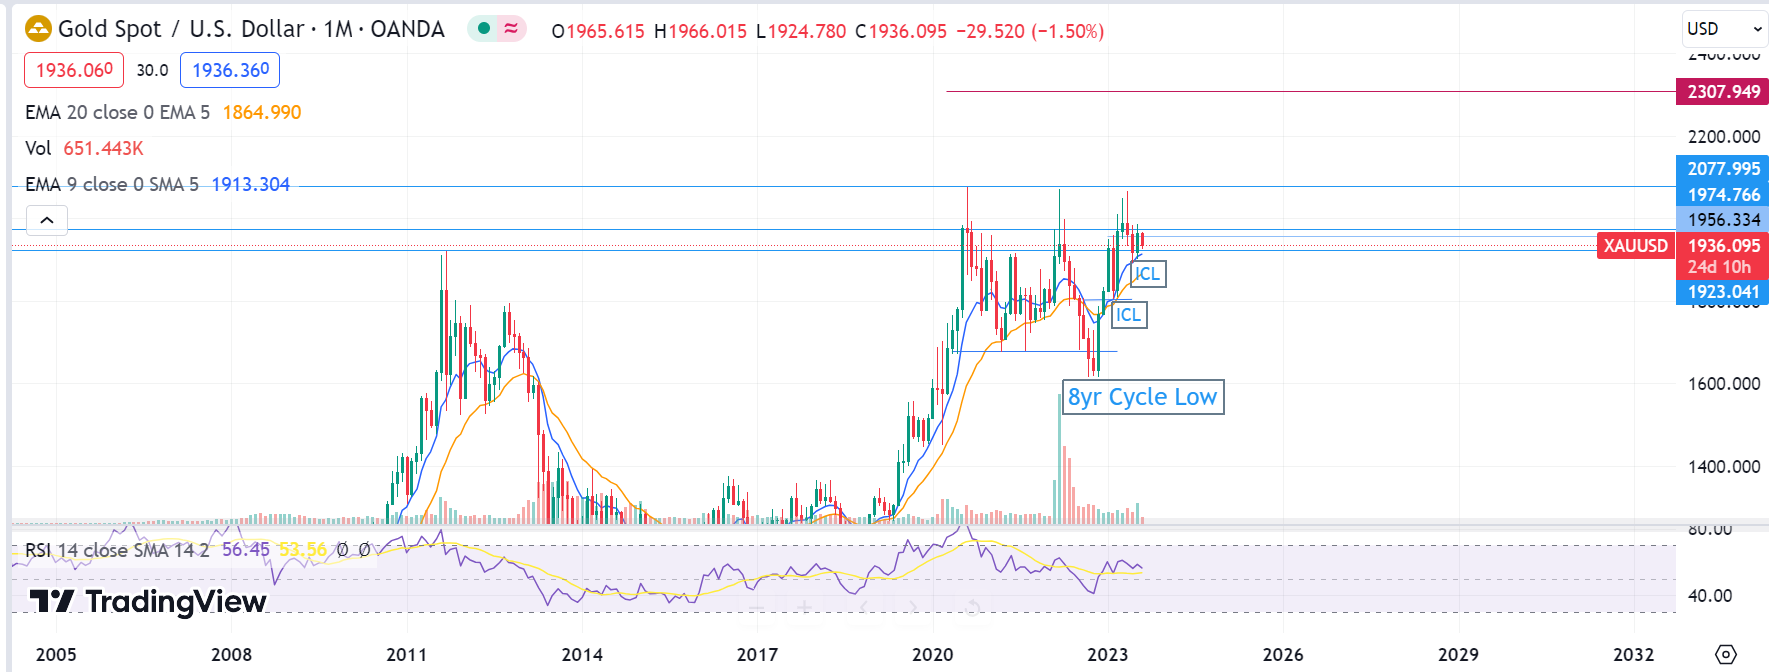
On the monthly view, I’m still of the opinion that we are in a bullish uptrend. With quite a lot of chop, to say the least ;-)
Higher lows and higher highs are in place, and the RSI is kind of in the middle as well, so definitely more room to the upside. For this to remain the case, we have to set out parameters that we wouldn’t want to see violated.
These levels are $1923 and $1893 on the downside. As long as these remain intact, I’m giving the metals the room to be as volatile as they please. Let’s dive into the weekly to analyze the structures over there!
(Weekly)

As we all have noticed, the bears have returned since our third attack on the ATH’s. Even when the bulls tried to break $1974 a couple weeks ago, they weren’t allowed to breakthrough. This puts more weight on the bearish scenario here. We have to remain patient and see for ourselves if the bulls can step up at the previously mentioned support levels of $1923 and $1893. It seems quite obvious that a break of any of these levels signals significant bearish pressure, and that might delay the breakout for another couple weeks to months. On the positive side of things, there is, of course, also a scenario where bulls and bears will ping-pong the price between $1923 and $1974 until we finally resolve in either direction.
(Daily)

For the daily candles, we can clearly see the downward-sloping trendline as resistance and the very important $1923 level below. Same story and strategy as for the weekly and monthly levels: those levels need to hold, or metals are in for much more trouble. I want to point out that the volume has increased a ton in the last 3 weeks. This adds to my argument that some (sell-side) party stepped in to prevent a breakout.
XAGUSD
(Monthly)
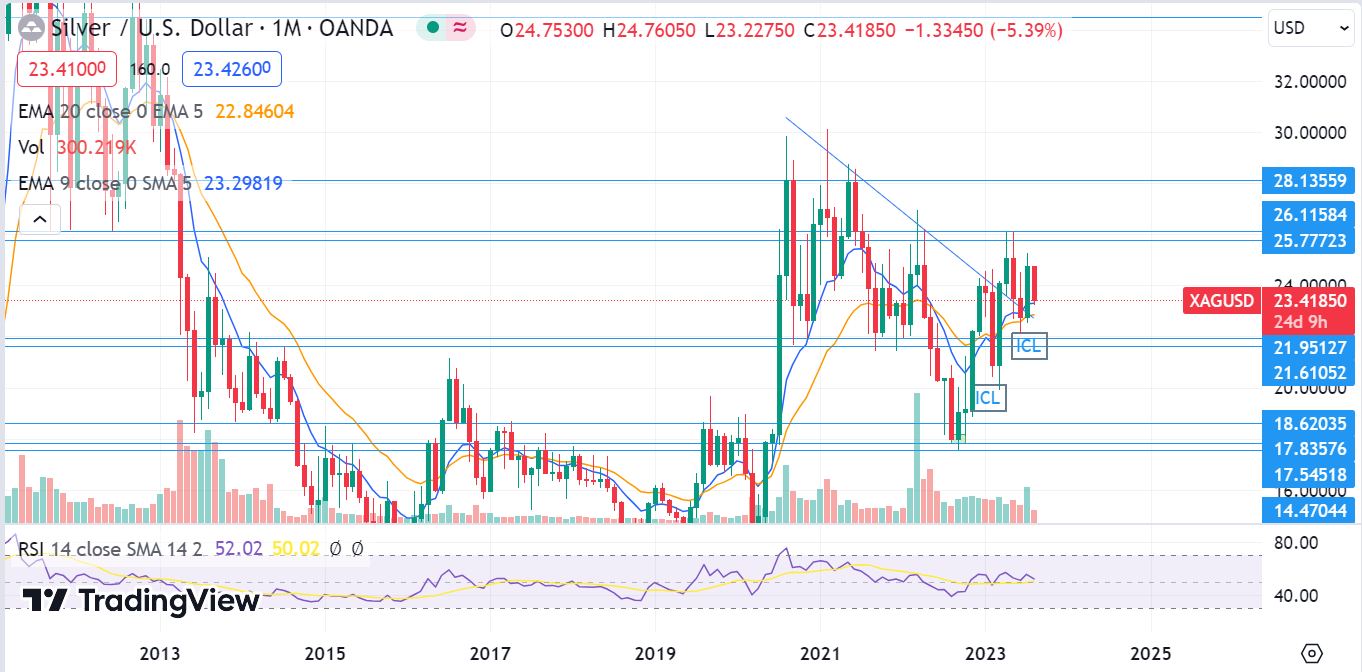
The monthly candles for silver are still intact, just as they are for gold. The level that needs to hold here is $22.11, or the double blue lines around the $21.5–$22 zone. We cannot have a monthly or weekly close below these levels. On the upside, we are dealing with the downward-sloping weekly EMAs, which I will highlight in the following chart.
(Weekly)
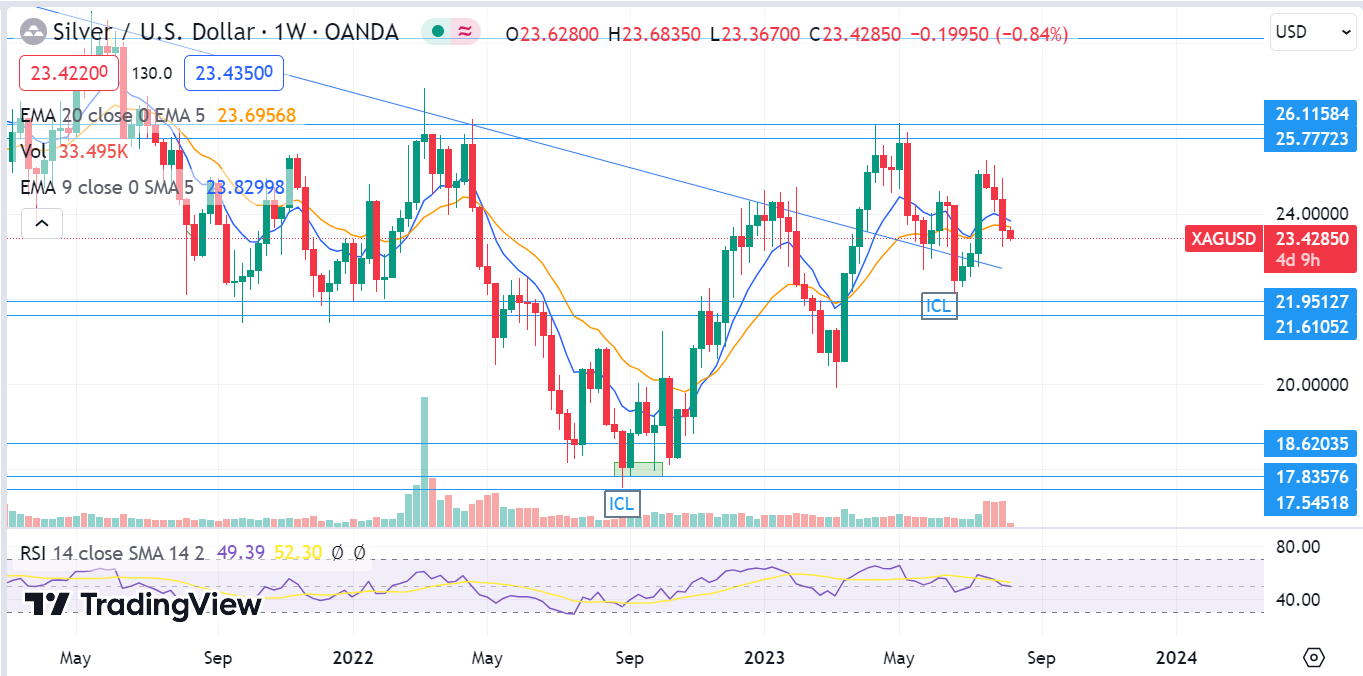
As we can see on the weekly chart, the weekly EMAs are starting to push the silver price downward. That’s why we use them as momentum indicators. Except for us being below the EMAs, we haven’t violated the greater higher high and higher low structure, so we are still in the bullish scenario. This is, of course, where silver needs to hold the line. We are extremely close to a cycle failure, which would occur with a weekly close below $22.
(Daily)

The daily chart speaks for itself; we might have made a DCL last Friday with that green wick to the downside. For this to be true, we would need to get back above both daily EMAs and make a higher daily close than that candle. Since we are waiting for cash on the trading positions, Im going to let this play out by itself since there is way too much chop to swing trade.
Summary
Silver has the $21.5–$22 zone below as support. The daily and weekly EMAs serve as overhead resistance.
Gold has $1923 and $1893 as support. $1974 on the upside.
Don’t overtrade in this tight range and let the price action play out by itself. That’s what I’m doing.
If you enjoyed the newsletter, don’t forget to like, share, and subscribe! This helps me tremendously in growing the newsletter. Also, did you know that by referring other people to subscribe (paid or free), you can gain additional free months of the paid subscription? Try it out below: