


Weekly Hot Take - Sit
10/04-14/04

Welcome friends!
I want to welcome you all to another weekly newsletter! We will start with a brief recap of last week and then dive into the analysis for the upcoming week.
I want to explain again for the paid private Twitter group that this is a benefit that the paid subs get. The group should be viewed as an extra you get, the main effort is still the newsletter. I did however start this private group as a lot of the subs were curious about which exact companies I buy, sell, or hold. If you didn’t get into the private twitter yet then you have to send me an email (again) stating your twitter handle. Please also send the actual request on twitter otherwise I can’t accept you.
Also I’m seeing that Twitter has blocked substack links and that twitter is coming out with its own paid service. We’ll see in the future how this progresses.
Precious metals
XAUUSD
(Monthly)

We can see that we have been progressing nicely in this bull trend for the metals. The EMA 9 and EMA 20 have been supporting the upmove. We said a couple weeks ago, before the decline into the most recent ICL, that we were expecting a brief retest and then a strong move back up. That is exactly what happened, as we are now advancing into all-time high territory. The next targets are $2077, which should be a temporary stop, and after that a straight zoom to $2200- $2300. It’ll become very hard to put targets on this move as these violent Elliott wave extensions can stretch really far. Also, this means that we will get very overbought on the monthly chart when the top is close. Let’s look at the weekly:
(Weekly)

On the weekly chart we can see that we got quite stretched above the EMA’s and therefore we got 2 sideways weeks around $1974. Now that the EMAs are almost there, it is likely that we will continue this uptrend into the $2077 target. It is very important to note that every dip is a buy, as mentioned. A downside target that might get hit on a pullback is $1923. For now, this target is still far away.
(Daily)

On the daily, we can see a very clear negative divergence. This means that a DCL is getting more likely the longer the negative divergence lasts. But an extremely important lesson in bull markets, as we have now, is that these negative divergences can be there for an extremely long time. On top of that, they can also be negated. So this is, in general, a very weak signal to rely on in a bull market. If the pullback into another DCL were to happen, then I would buy the shit out of the juniors ;-) otherwise, you will have to FOMO, I fear. Even though I have been guiding this rally and pullbacks where one should’ve bought, I can imagine that there are still lots of people who didn’t trust the rally and have cash positions.
A funny anecdote is that Brady called the negative divergence all the way up during the first intermediate cycle of this bull run. Let’s see how long he persists this time.
XAGUSD
(Monthly)

WHAT A CHART! The monthly has officially broken out of the downward-sloping trendline of the past years. This implies that bulls have an incredible opportunity to squeeze out all shorts and bears that have been partying for the last 10 years. For our analysis, we are in wave 3, meaning that we will get very wild and very overbought. The most likely outcome here is a rather quick move over the coming weeks to $28-$30 silver level. It is very likely that we pause for a while, and then we do the breakout move. Juniors should do a 1000% measuring from current levels. Let’s check out the daily levels now directly to save some space for the miners.
(Daily)
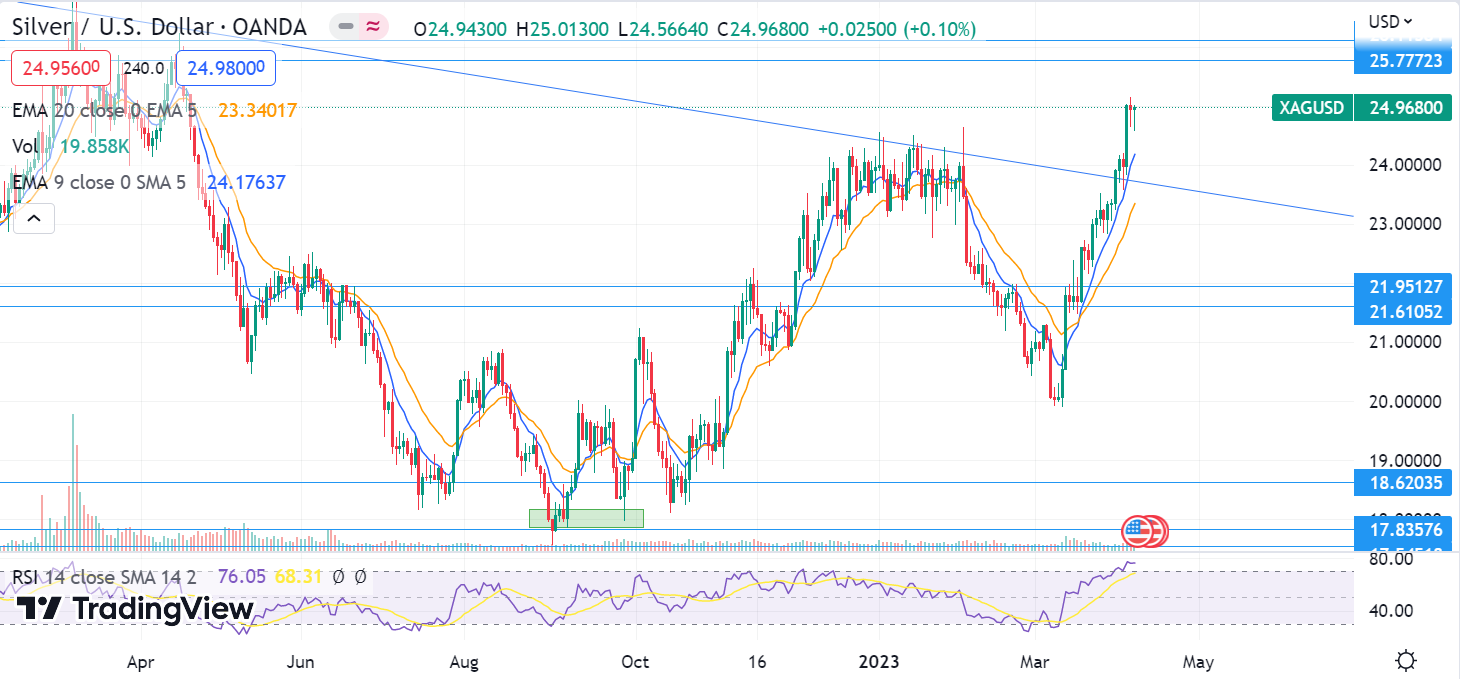
On the daily chart we can see the already talked about overbought conditions. These will most likely be here during the whole longer term upmove. However since we’re definitely not permabulls here I want to lay out the levels below for a pullback. The downwards sloping trendline is THE target, with a potential undercut to $23 for a pullback. Knowing this, the pullback is a buy! To the upside, I see my two lines at $25.77 and $26.1 as a resistance zone. Above that, it is straight to $28.
Miners
GDX
(Daily)

We have been tweeting that it was very likely that the $33.33 level would be taken out and that the inflow would accelerate, and that is exactly what is happening. Very good development of making a higher high as this negates all of norvast’s party the past couple of years ;-)
Summary
Gold and silver monthly charts looks extremely bullish.
Daily negative divergences mean NOTHING and are unreliable in a strong bullmarket.
Silver has $26 resistance ahead and $23 below.
Every dip is a STRONG buy
Expecting this rally to become very overbought and very stretched the deeper we go into wave 3.
Have a great time, we deserve this after the past couple of years.
Great work as always!
Do we have an idea how high Silver can go in 2023?
I'm just curious, so just playing with that question :)