


Weekly Hot Take - The Capitulation
27/02-3/03

Welcome Friends!
Thank you all for reading the weekly newsletter again! This week we’ll start with a little recap on last week and then we will go over the expectations for next week! We will only focus on metals this week as on they look very close to invalidating the bullish upmove since the summer. On the one hand, the bulls have lost some significant ground. On the other hand, there are some good signs for bulls. I encourage everyone to fully read the newsletter as there are very important signs that we will discuss! Let’s dive into it!
Recap of Last Week

Last week we talked about the signs of change and guessed that there would have been a daily cycle low. But this was clearly negated this week as we didn’t rise enough days before we broke the lows again. Once metals are in capitulation it’s clearly hard to call the exact bottom. However let’s look at the facts right now and try to draw the potential scenarios here so that we are prepared.
Precious Metals
$XAUUSD
(Monthly)
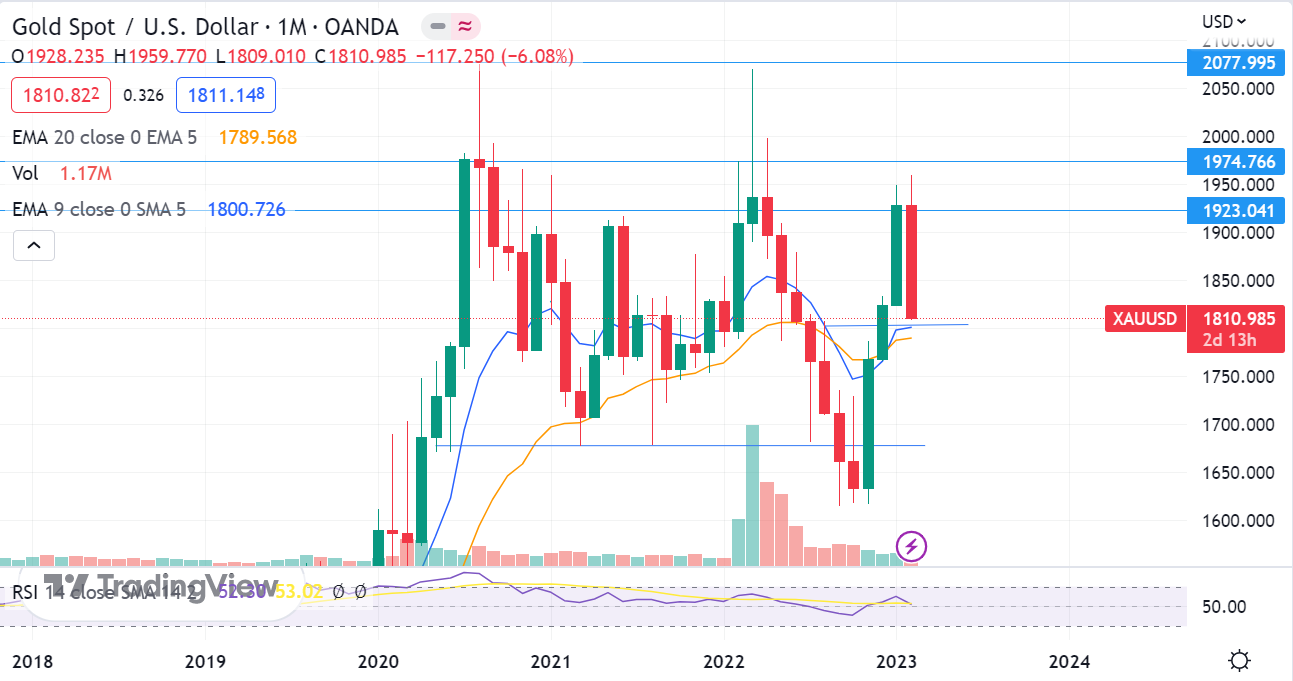
We’ve talked many times about the importance of momentum via the EMA 9 and EMA 20. The chart shows us that we’ve gotten a pretty severe downwards rejection around $1923 and we’ve finally reached close to both EMA’s. This is a very very important zone. Right now the ema’s are lining up between $1785 and $1800. This is a MUST hold zone for me. Below this zone and this was one nasty trap to get bulls excited. But let me tell you in the weekly chart and daily chart why there are some good signs for the bulls aswell.
(Weekly)

On the weekly we’ve broken down below the ema’s , a brief touch of $1785-$1800 is still possible but afterwards I expect a multiday rally and from there we’ll have to see what metals want. Let me highlight the positive news: there were some nice blocks on the lows last week friday during the dump. This means that institutions are buying the other end of this slaughter. Giving this is lining up with the big MUST HOLD zone of $1785-$1800, I’m thinking this will be atleast a temporary stop.
(Daily)

On the daily we can clearly see that: as good as the ema’s work on supporting the price to the upside, as good as they also work on pushing the price downwards when the trend is down. Same zone here: $1785-$1800 is the final destination for current downmove. Below = new lows. But don’t think this happens that easily. We should atleast see a big bounce from that zone.
$XAGUSD
(Monthly)

For the monthly candles on silver we’ve sliced aggressively through the strong support zone of $22-$21.5. This is initially a very bad sign for bulls. I really need to see us crawl back over $22 very very soon. As in the next 2 weeks. Otherwise silver will make new lows. As long as we can get back above $22 and then hold, this was the scary wave 2 pullback within a wave 3.
List of thoughts:
The weekly cycle is in declining phase. (cycle analysis)
There are important supports broken
The last hope for the bulls is the $20.25 zone in silver and the $1785-$1800 zone in gold. (lowest point allowed according to EW)
Break the levels in point 3 and we get new lows
Hold the levels in point 3 and we analyse the bounce.
(Daily)

You can see on the daily candles for silver that we’re extremely oversold on the daily. We are more oversold on the daily then when we were at $17,52!! We’re right in the middle of two important fibonacci levels. So it’s pretty likely that we still shake it all out to the 0.618 level and that we then bounce back higher. The second reason why I think the we will bounce higher next week is because also here I’ve seen some institutional prints that are being printed on the lows of the day during the slaughter. Downside expectations before bounce is $20.25.
I’ve skipped the weekly here to summarize the situation as it is:
Summary:
We’ve lost our momentum of the first upmove in silver, since we’ve broken the monthly ema’s
$20.25 is the lowest silver can go for a daily close!
Gold needs to hold $1785-$1800 for bulls or we are going back to the lows.
Next week a bounce is very likely due to the institutional buys on the lows of last friday.
We are going to assess the strength of the bounce, and then we’ll be able to see if we are going back to the summer lows or not.
Best of luck everyone! I will be tweeting if we are seeing confirmation of a local low.
GG - Thx for the excellent assessment as always!
I haven't read all the archives yet, so forgive me if you've already touched on this. But curious what other evidence (beyond chart TA) you refernce when assessing PM? (Block trades, Options structure "sweet spot", Open interest, COT report, physical premiums, DXY, Treasury rate spreads. Momentum analysis on charts.) If so what do you find the most helpful?