Welcome friends!
Last week we discussed “cycle failure or shakeout?” in the newsletter below:
Weekly Hot Take - Cycle failure or Shakeout?
Welcome friends! Hello everyone, In this week’s weekly update, we will talk about the events of last week and how to interpret them for the upcoming week. We saw a severe decline right after the early warning on private Twitter. This warning at $25.27 was followed by a -6% move! Right now we have also hit the major pullback target at the 0,382 Fibonacci level, which might provide some support, but let’s talk in more detail about what factors are driving the price here.
Since the sharp and timely call for a pullback on the private Twitter, we have been more cautious with upside expectations. While it’s still possible that we go over $26.1 silver, I assume this possibility is decreasing with every day that goes by here until we get a deeper shakeout. I have to say that the sentiment, however, feels extremely bearish, so that is going well for the bulls. It’s extremely complex here to see what will be coming next, so let’s get right into the newsletter, where we’ll discuss potential areas for longs again or areas where we have to exit certain positions.
Have a great read, and if you want to read the full report, click the button below :
Precious Metals
XAUUSD
(Monthly)
The monthly chart now looks more and more like it’s going to close as a red inverse hammer, showing that the resistance at ATHs is pretty much valid. We briefly dipped below $1974 but recovered it right before last week’s close. For the monthly view, we want gold to stay above both EMA 9 and EMA 20 and that is still the case, so I’m not going to change my bullish stance on the monthly view for gold. But it does look like more consolidation or pullback is needed with the outlook of the current monthly candle. I’ll highlight on the weekly chart where I expect the price to go now.
(Weekly)
Given the current red candles on the weekly chart, a brief retest of $1923 at the minimum can be expected. A level we have highlighted in newsletters in the past. It seems like it’s going to get retested after all. The bright side for the bulls is that we recovered the important $1974 level. So if this last week of the month proves to be a very strong upward week, then we can have more hopes of directly going up without further pullback. There is also the ‘debt ceiling’ event coming closer, so that might heavily influence the price in either direction.
(Daily)
For the daily chart, I expect these two possible routes, whereas the blue route will be taken if we close this month below $1974, and if we manage to have a very strong last week, then the orange route is much more likely. The orange route would be fuelled by the buyers that waited for their entry but then had to fomo into their position. I look forward to whatever the market decides here. We remain long on the general juniors as long as gold stays above $1923 + the monthly EMAs!
XAGUSD
(Monthly)
The monthly silver chart shows that we're nicely bounced off of the downward sloping trendline, and therefor I’m looking up on the longer timeframes for silver. The second argument to be bullish is that we are above the monthly EMAs, which has been our momentum indicator. I’ll highlight precise levels on the daily chart.
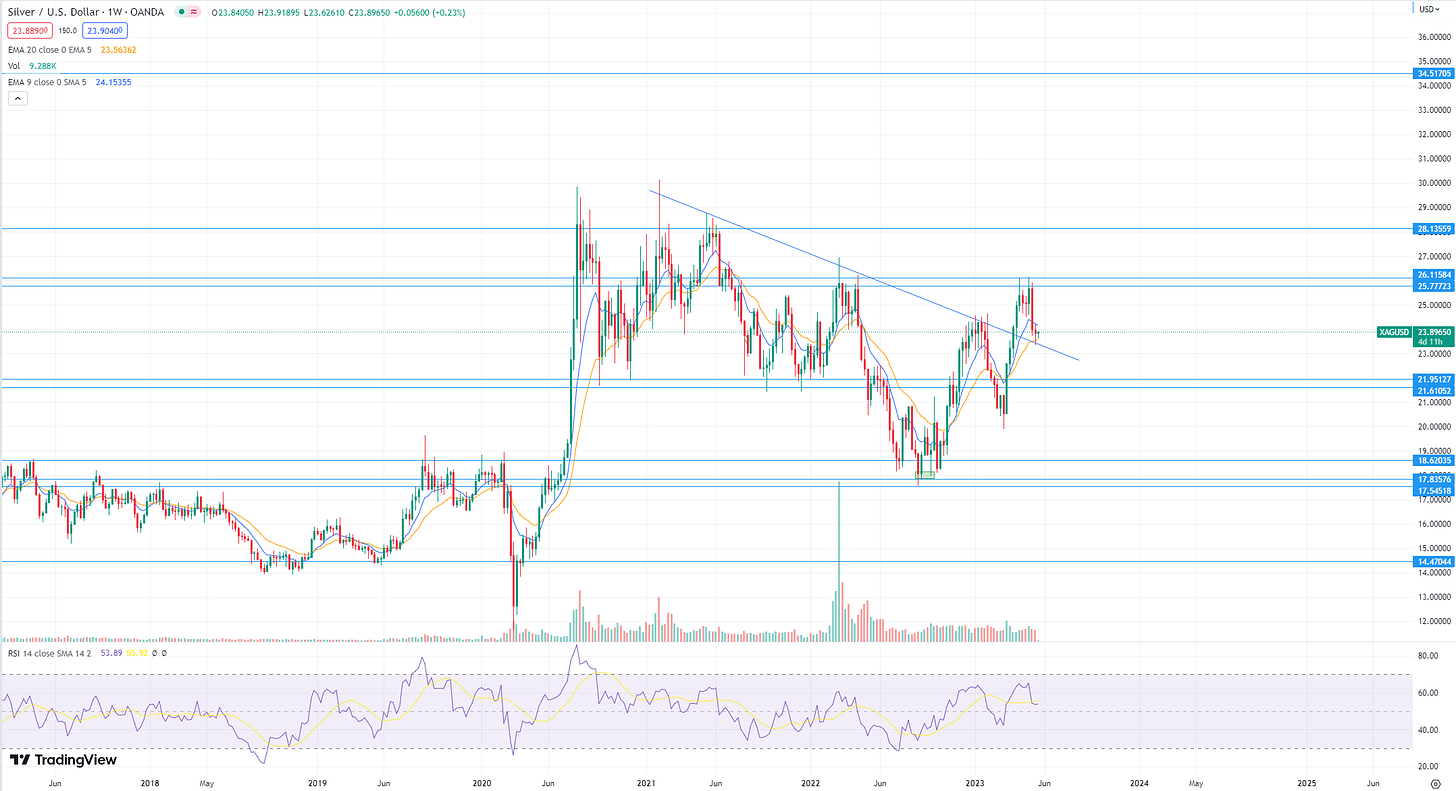
(Weekly)
On the weekly chart, we see the same clean backtest. The only worrisome fact here is the speed of the sell-off that we got since the warning in the private Twitter. As long as silver stays above $23.75, we have a shot at breaking $26.1 again. If we break $23.75 first for a solid daily close, then we’re looking at $22.27! For the bullish scenario, I also want silver to recapture the weekly EMAs ASAP!
(Daily)
This beautiful daily chart shows that there is a slight chance that we’ve done an extremely clean backtest of the downward sloping trendline that we broke out of a couple weeks ago. Excited to see if silver can push through and regains its daily EMAs to send it over $26.1! Briefly for the downside scenario, $22.27 is the must-hold line. Below, we will exit the positions.
DXY
(Weekly)
For the dollar, we want the $103,81-$104 resistance to hold or a slight false breakout above and then a move back down. If we have two consecutive weekly closes above the resistance zone, then the bull market for metals is in danger. Otherwise, everything looks very good on this backtest.
Summary
Monthly views look good for more upside
Weekly candles should be strong and upwards this last week of May to help the bulls breakout directly.
If the weekly candles are weak again, then we can expect $1923 and $22.27 for gold and silver, respectively.
DXY is looking like it’s completing a backtest to ~ $104! Bulls want a drop after the backtest is completed.


@seanm2201
Subscriber
Approve for private Twitter asap; Please!